Mastering the VWAP: How NinjaTrader Traders Use It for Better Entries and Exits
In intraday trading, accuracy is paramount. One miscalculated entry or timed exit can cost the trader precious points and profits. That’s where indicators such as the NinjaTrader VWAP indicator come into play. Volume Weighted Average Price (VWAP) is not merely another line on a chart; for serious traders on NinjaTrader, it is an accurate measure of market sentiment, strength of trend, and institutional activity.
In this article, we’ll explore how traders can harness VWAP on NinjaTrader to make smarter, more confident trading decisions.
What is VWAP and Why Does It Matter?
VWAP is the measure of how much a security has traded, both in volume and price terms, during the day. Simple moving averages don’t place as much emphasis on high-volume days and therefore aren’t as reflective of where the “smart money” is.
For NinjaTrader traders, the NinjaTrader VWAP indicator truly shines when paired with other market indicators such as volume profile, order flow, and the NinjaTrader footprint chart. VWAP is also a dynamic support/resistance level and a trend confirmation indicator. The price above VWAP shows that the buyers are dominating; below, the sellers are dominating.
VWAP for Trade Entries
The best use of VWAP by traders is in the identification of high-probability entries. In conditions of a bullish market, there will be a price retracement to VWAP before traders enter long positions. This serves to protect them from buying at overbought prices.
In conditions of range-bound or mean-reversion markets, VWAP serves as a price magnet. Traders fade extremes above or below VWAP and anticipate that the price will revert to the mean.
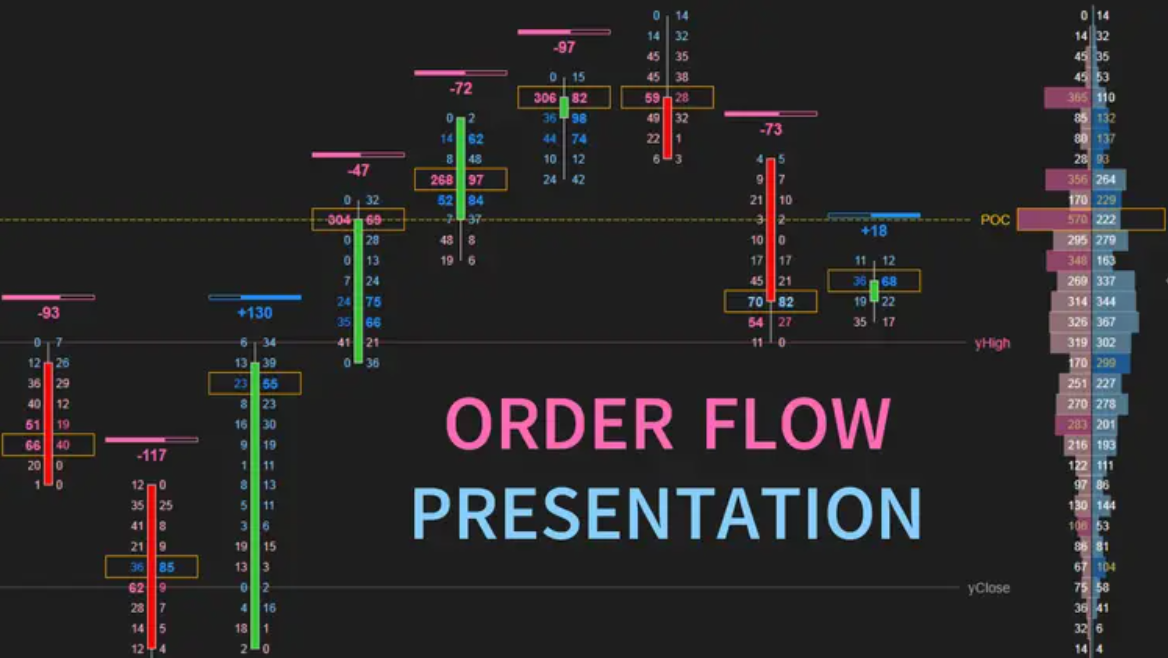
For instance, a NinjaTrader footprint chart can identify absorption or exhaustion at VWAP and utilize it as a reversal signal or entry point.
VWAP for Exit Trades
While VWAP assists in entries, it also constitutes a suitable level of profit-taking. Professional and institutional traders refer to VWAP as a reference point. Breaking at VWAP or around VWAP when price begins to rest, volume dwindles, locking profits prior to losing momentum.
Also, VWAP bands or high and low standard deviations are used by some traders to make exit plans. When price crosses two or more deviations from VWAP, it typically indicates exhaustion and is a good point to look to exit trades.
Blending VWAP with the Footprint Chart
NinjaTrader’s footprint chart gives accurate details regarding the way markets act, e.g., ask/bid volume and imbalances at a certain price level. In combination with VWAP, price not only looks to the trader relative to average value, but also to who is in control (sellers or buyers) at that price level.
For example, if the price is nearing VWAP and the footprint reveals aggressive buying with spikes in delta, a breakout above VWAP is more plausible. On the other hand, if sellers are prevailing at VWAP, it could indicate a failed retest and reversal.
Conclusion
Mastering the NinjaTrader VWAP indicator isn’t so much about drawing a line; it’s about understanding how price responds to value and volume in the moment. Combined with the NinjaTrader footprint chart, VWAP is a must-have for optimizing entries and exits.
For intraday trading-level VWAP software, the Ninza.co Intraday VWAP Pro has such features as VWAP bands, auto session detection, and live update. It is designed with one single objective in mind: to improve decision-making and performance in rapidly moving markets.


How to Find the Right Expert to Guide Your Business Sale
The sale of a company is hardly ever easy. It entails pricing, negotiations, confidentiali…

Professional Podiatrist in Kowloon and Central for Complete Foot Care Solutions
A person’s foot health is essential for their overall health, but expert podiatric care …


